Crane Project
Navigation
![]() Excel File with
Materials Testing with Strain Gauge Data
Excel File with
Materials Testing with Strain Gauge Data
![]() Photos of
Plastic Samples After Testing
Photos of
Plastic Samples After Testing
![]() Close-Up Photo of
Peeled Strain Gauge
Close-Up Photo of
Peeled Strain Gauge
![]() Interpretation
of Files from Lift-Off
Interpretation
of Files from Lift-Off
Slides for Strain Gauge Briefing, November 2, 2006
![]() PDF, < 1 MB
PDF, < 1 MB
![]() PDF 6-to-a-page, < ½ MB
PDF 6-to-a-page, < ½ MB
![]() PowerPoint, > 25 MB
PowerPoint, > 25 MB
Materials Testing
Excel File with Materials Testing with Strain Gauge Data
This file contains the data taken in the Materials Lab in several sessions. Load and stretching data from the testing apparatus are tabulated with data taken from the Portable Strain Indicator using strain gauges.
The sample measurements are included with each data table:
![]() W is the sample width in decimal inches.
W is the sample width in decimal inches.
![]() T is the sample thickness in decimal inches.
T is the sample thickness in decimal inches.
![]() D is the diameter of the holes in the ends of
the samples in inches.
D is the diameter of the holes in the ends of
the samples in inches.
Data on the lengths of the samples is TBA.
Click here to download the Excel file.
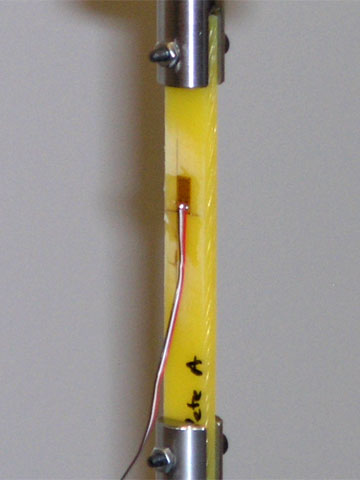
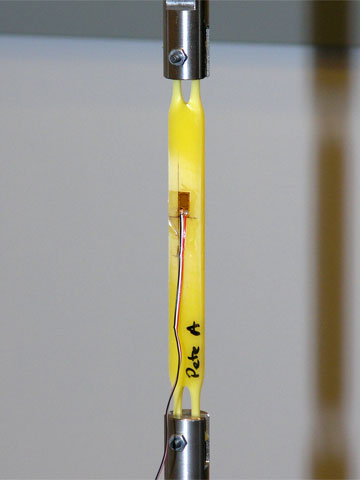
Photos of Plastic Under Test
Here is a plastic test sample at the beginning of the test,
and with 500 pounds. Note that the holes
have stretched to the point that they have extended out of the holding fixture.
|
|
|
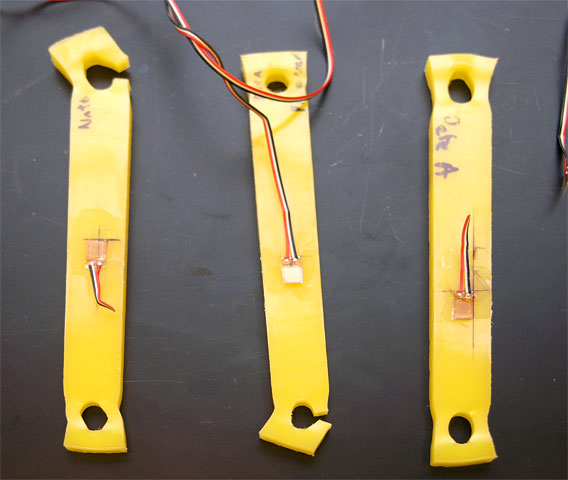
Photos of Plastic Samples After Testing
Here are the three samples after testing to 500 pounds. Note that two samples have failed catastrophically and all three samples exhibit severe plastic deformation. Note that the strain gauge on the center sample has peeled.
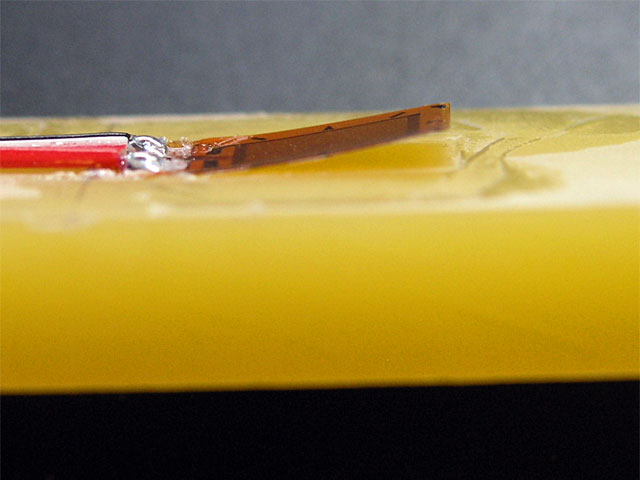
Close-Up Photo of Peeled Strain Gauge
Data Files from Lift-Off
These are Microsoft ® Excel ® files that were written by the oscilloscope during your first lift. The file names are of the form <Section>-<Team>_00.xls, as 1-4_00.xls for example. Occasionally more than one file is written for a given team. When more files exist for your team, the last digits are incremented, as 1-4_01.xls for example.
Each Excel file has several tabs. A typical file will have several worksheets. The worksheets Sheet1, Sheet2, and Sheet3 are the default sheets and are empty. The files written by the Oscilloscope are ScopeData 1 and ScopeData 2. Each worksheet will have a plot of the data embedded in it. Occasionally there will be an extra sheet.
The data provided to the oscilloscope is from the analog output of the Portable Strain Indicator P-3500, amplified and filtered by a breadboard circuit built for this purpose. The data has noise and hum on it because the strain gauge voltage is tiny and the enormous amplification in the P-3500 necessary to access the data picks up noise from the building lights and power. The worksheet ScopeData 1 will have the first file written on the first lift of 280 pounds. The worksheet ScopeData 2 has data taken while the crane is holding the 280 pound weight and the swinging has stopped. A typical plot from ScopeData 1 is shown below as Figure 1.
Figure 1. A typical oscilloscope pattern showing the transient lift forces on a spar in your truss.
Click on one of the links below for an HTTP download window.
Interpretation of Files from Lift-Off
A description of how to interpret the oscilloscope plots follows. Refer also to the slides presented in the lectures during the week of November 2.
A typical oscilloscope data file will contain a first-lift waveform such as Figure 1 or a waveform such as Figure 2 below.
Figure 2. A typical oscilloscope pattern showing a quiescent truss load after a lift.
You will also have a figure in microstrains called out during your first lift of 280 pounds. These can be combined to give you dynamic loading on the truss member you used for your strain gauge readout as follows.
In all cases, the truss was in compression during the load. The strain gauge output is therefore a negative voltage, and your steady-state strain reading called out during your first lift is a negative reading from the Portable Strain Indicator P-3500. In Figure 2 this average is about -0.27 volts.
The analog output of the Portable Strain Indicator P-3500 is undocumented. The circuit that we use to drive the oscilloscope amplifies by a factor of about 10 to reduce sensitivity to hum and noise, so the output of the Portable Strain Indicator P-3500 is about 0.027 volts, so it is probably the output of the Wheatstone bridge multiplied by 1,000 in the instrumentation amplifier as indicated in the slide presentation of the week of November 2. You can calibrate this output to the strain in microstrains that was called out during your first lift. The calibration factor SCF is taken from the quiescent, or steady-state numbers for strain and average voltage while holding the load:
![]()
The load calibration factor LCF, which relates the voltage to your load,
is found similarly:
![]()
With the LCF you can use the oscilloscope plots to provide plots of dynamic
load on your truss during the initial load when bending and other dynamic
forces are at work.
The peak dynamic load and average
load as instrumented by the Portable Strain Indicator provide an important
component of the safety factor of your truss:
the ratio of peak dynamic load to average load. There must be other components in your safety
factor, but this very important component is simply the ratio of peak to
average voltages, where the peak voltage is taken from Figure 1.
When You Have Positive Voltage
Your average voltage, peak voltage, or waveform may have positive voltages. This means that your strain gauge is indicating that the beam that it is mounted on is showing extension, not compression. This is because this beam is bending away from the strain gauge. This can happen for a number of reasons, including, but not limited to, the following:
![]() Your beam is flexing due to a buckling
stress. This can be caused by the way
that it is mounted, or by a stress near its buckling failure stress.
Your beam is flexing due to a buckling
stress. This can be caused by the way
that it is mounted, or by a stress near its buckling failure stress.
![]() The truss itself is flexing. This can happen if the truss is not
adequately cross-braced.
The truss itself is flexing. This can happen if the truss is not
adequately cross-braced.
![]() The weight is swinging to one side. This will cause the truss to bend to that
side, which will cause the beams to bend in that direction.
The weight is swinging to one side. This will cause the truss to bend to that
side, which will cause the beams to bend in that direction.
Very high voltages and strain readings.
Strain readings should be on the order of -30 to -60 microstrains. Higher readings are an indication that your truss is near failure.
Multiple plots in the Excel file
Occasionally a good reading was not obtained, and the lift was repeated. Occasionally the strain gauge was in place for the second lift and the data was recorded. Or, a waveform does not look right for one reason and another and the lift was repeated.